P201 Menu
Exploratories
Student Design of Drop Bounce Experiment
The day before the experiment the students should be placed in groups
according to their learning styles. They should be given the following assignment
and given some time in class (if possible) to work on it. This lab can be
used as a culminating activity for the unit Habits of the Mind. The
Drop Bounce Lab addresses all of the learning objectives from Working
With Others to Explains Results. If the experiment is performed
near a concrete block or brick wall students can estimate the distances
to the nearest 1/4 of a block. The experiment could be done just as easily
with meter sticks. Either approach leads to the discussion about estimation.
Student Homework Assignment:
Problem:
What is the relationship between the height from which a ball is dropped
and the height to which it bounces?
Procedure:
You are to design a lab experiment to answer this question. You should
consider the following as you design your lab:
What equipment will you need?
What data do you need to collect?
What variables must be measured? Which variable(s) do you control?
Set up a data table to help in organizing your thoughts and data collection.
Teacher Discussion Before Drop Bounce Lab:
The morning after the homework assignment where the students design
their labs, the teacher should look over the designs quickly and allow
for some discussion. The primary emphasis of the teacher discussion should
be about estimation. Emphasis should be placed on the fact that ALL measurements
involve making estimations no matter how accurate the instrument. Comparison
could be made between estimating the distances to the nearest quarter of
a concrete block to estimating to the nearest centimeter on a meter stick.
Once the experimental design has been approved, students will perform
the experiment measuring the height from which the ball is dropped and
the height to which the ball bounces and graph the data.
A copy of a pre-designed lab is attached in case there is not enough
time during the first few days to allow for student-designed labs
Student Discussion of Drop Bounce Lab:
The students should be allowed some time within their groups to get
the data into table form, graph the data and discuss what it means. They
can compare their graph with the graphs from other groups.
Drop Bounce Lab
Problem:
What is the relationship between the height from which a ball is dropped
and the height to which it bounces?
Materials:
"Superball" or other balls, wall made of cinder blocks or
bricks, (meter stick - optional)
Procedure:
1. The experiment should be done near a cinder block (or brick) wall
so that the distances can be estimated to the nearest fourth (1/4, 1/2,
3/4, 1) of a cinder block. Some time should be spent in the beginning to
practice estimating distances this way.
2. Divide the activities so that one student drops the ball, one student
watches the bounce and estimates the height to which it bounces, and one
student records the data.
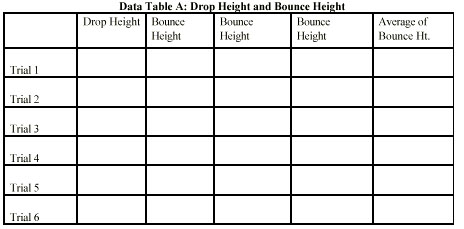
3. Drop a superball from various heights. The height to which the ball
bounces is to be estimated as carefully as possible. Both the height of
drop and the height of bounce should be recorded in data table A.
4. Drop the ball at least two times from each height with the average
of the bounce heights used asthe final measurement. If there is too much
variation in these two measurements, take a third measurement.
5. Drop the ball from at least six different heights beginning at about
two blocks. Increase the height of drop by at least one block at a time
until six or more drops have been completed.
6. Care must be taken in doing the estimations. Drop the ball from the
line between cinder blocks/bricks to make the measurements more accurate.
Use the same point on the ball (top) or (bottom) when judging both the
height of the drop and the height of the bounce.
7. Draw a graph of bounce height Vs drop height.
8. Draw a best fit line for the data points. Note: This is NOT a line
drawn to connect each point. It is a line which best shows the relationship
involved - in this case a straight line.
9. Compute the slope of the best fit line. Note: This is NOT the slope
between the first and last data points.
10. Write the equation for the graph using the slope-intercept form
( y = mx + b ). The line of the graph may not go through the origin
as the bottom cinder block may be elevated above the floor.
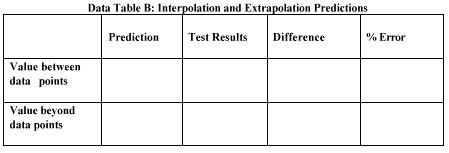
11. Use the graph to predict the height of the bounce for a ball dropped
half way between two drop heights. This is called interpolation. Record
your prediction in data table B.
12. Use your graph to predict the height of the bounce for a ball dropped
from twenty or thirty bricks high. This is called extrapolation. Record
your prediction in data table B.
13. Test the predictions by dropping the ball from the chosen heights
and measuring the bounce. Compare your predictions with the results from
testing. Check with other groups and see if their results are similar to
yours.
Summing Up:
1. Were your measurements that you took during the lab precise? Were
they accurate? What's the difference? Describe how your measurements were
or were not precise or accurate.
2. After reading over the information on sources of error from handout
H012, identify all sources of error for the Drop Bounce Lab. List
each and label it as one of the three types of error given in the handout.
Then explain how each of the sources of error in the lab could be minimized
3. Identify the dependent and independent variables in this lab. Explain
what the rule is for graphing independent versus dependent variables.
4. What happens to the bounce height as the drop height increases? What
relationship does this suggest?
5. Calculate the bounce height for a 3.5 meter drop. First convert your
units of brick/blocks to meters. (Show your conversion process)
6. How does your answer for the above compare with that of other groups?
Is it larger, smaller the same?
7. If there is a difference, explain in detail what you believe accounts
for the difference.
8. After you graphed your data you were asked to interpolate and extrapolate
information from your graph. What do you conclude about the accuracy of
information found from a graph by interpolating between data points and
extrapolating beyond them? Explain your answer.