
Forest Ecosystems In A Changing World
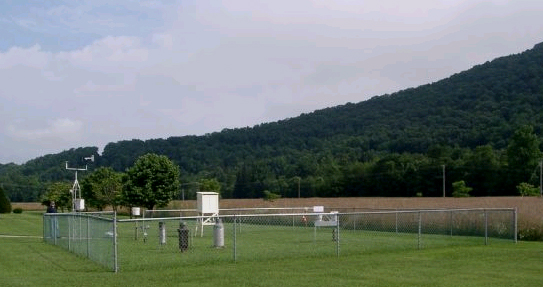
Site of long-term weather and precipitation chemistry measurements (NADP site WV18)
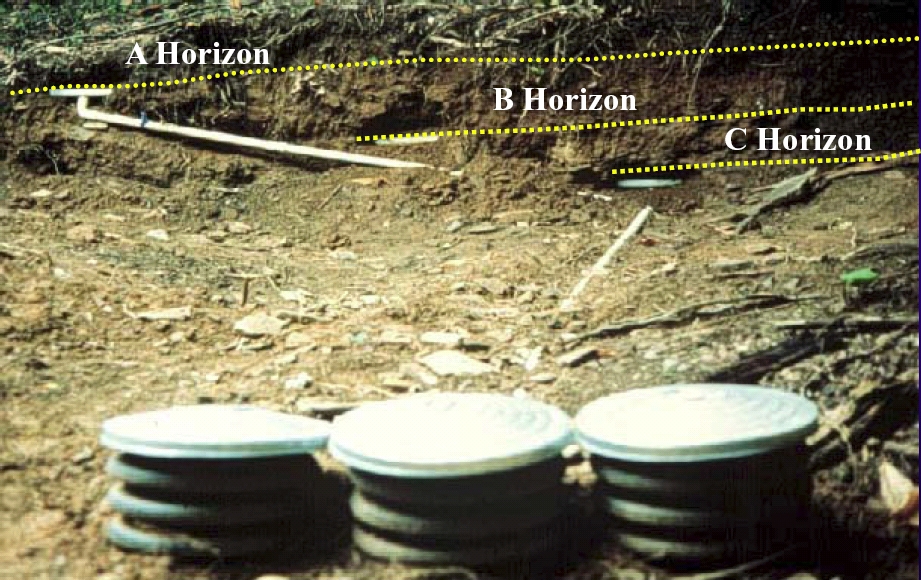
Tension-free lysimeter after installation and prior to being backfilled.
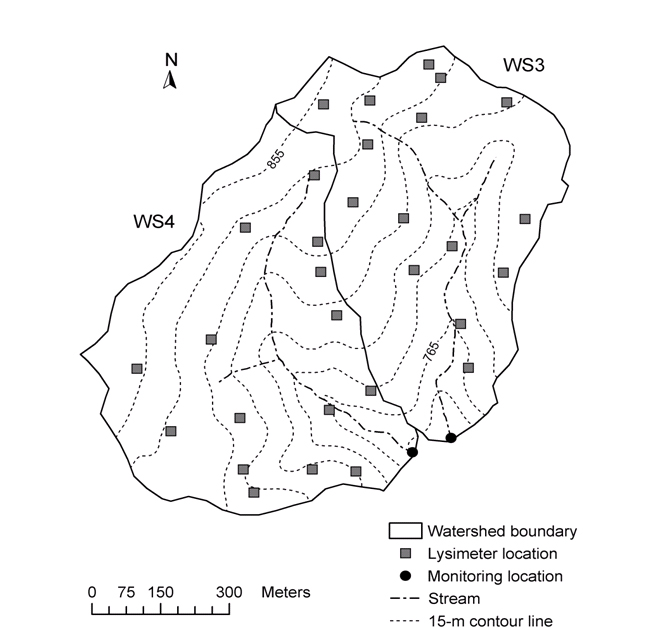
Location of soil pits and tension-free lysimeters in Watersheds 3 & 4 (From Edwards et al. 2006).
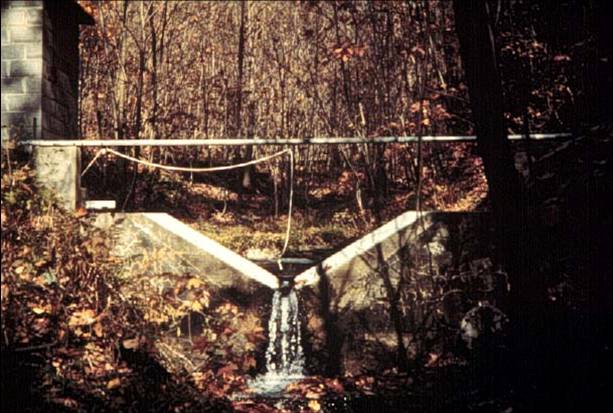
Weir on stream draining Watershed 3.
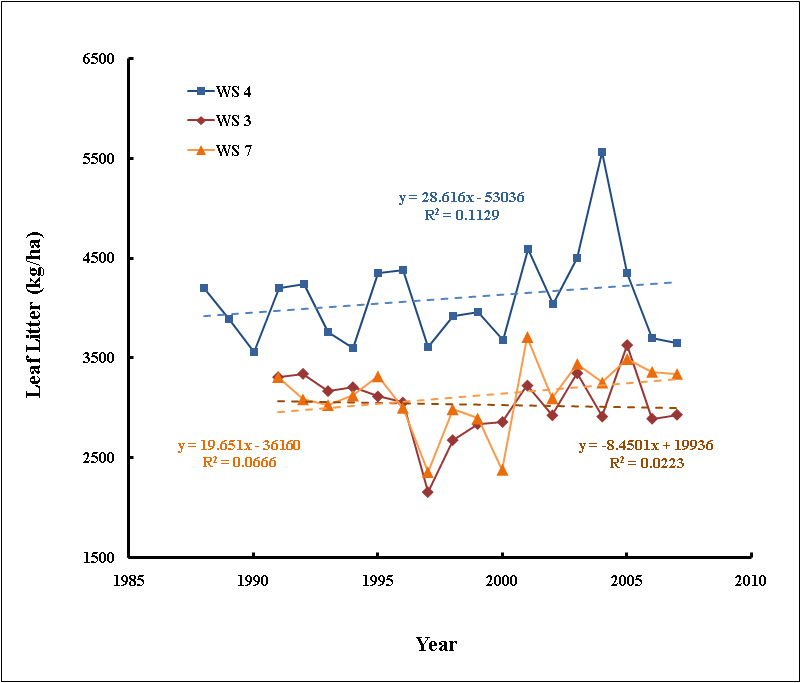
Long-term leaf litterfall data.
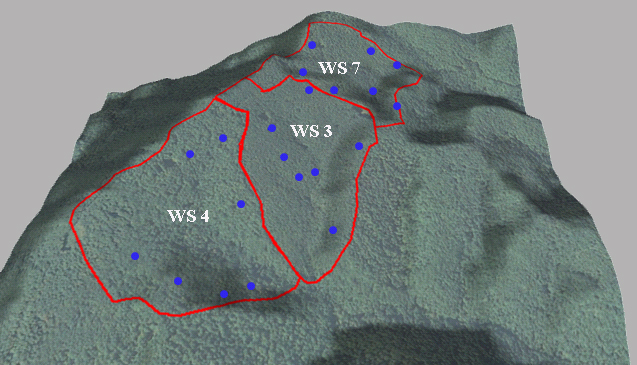
Location of long-term soil net nitrification & net mineralization measurements.
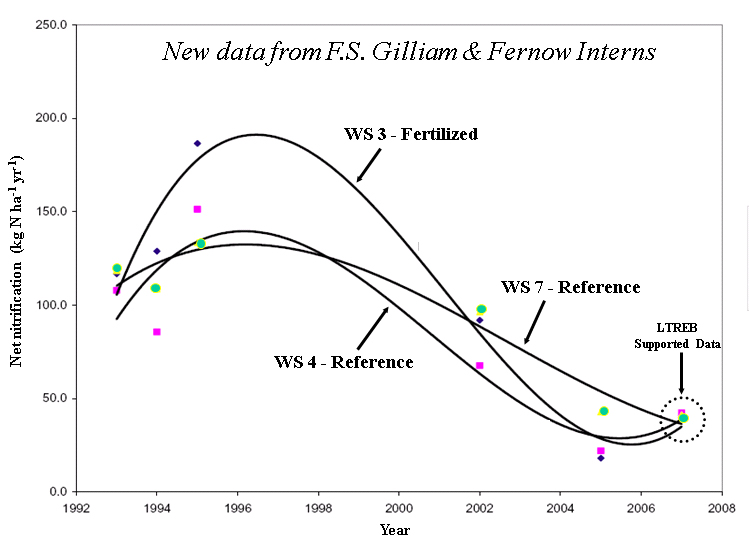
Annual net nitrification estimates for Watersheds 3, 4, & 7.
 Long-Term Measurements
An important part of the Fernow LTREB project is the continuation of long-term hydrological, chemical, and vegetation measurements that have been routinely made in the reference watersheds, whole-watershed fertilization experiment, and LTSP experiment.
Hydrological & Chemical Measurements - Precipitation is measured weekly using standard rain gauges at seven locations within the FEF. Wetfall samples for chemical analysis are collected with an Aerochem-Metrics Model 301 wet/dry collector located in a forest opening on WS 4, and at the nearby NADP site (WV18). Weekly bulk precipitation samples are also collected for chemical analysis in a forest opening on WS 4. During the growing season these samples are collected using an 8-inch-diameter polyethylene funnel which drains into a 2-L polyethylene bottle. During the non-growing season, bulk precipitation samples are collected in the same opening using an open bucket.
Streamflow from all watersheds is measured using 120o sharp-crested V-notch weirs and FW-1 water-level recorders. Weekly grab samples of stream water for chemical analysis are collected just upstream from each weir pond. All precipitation, stream-water, and soil leachate samples are analyzed for conductivity, alkalinity, Ca++, Mg++, K+, Na+, NH4+, pH, NO3-, Cl-, and SO4= at the USDA Forest Service’s Timber and Watershed Laboratory in Parsons, WV. The analyses performed at the Timber and Watershed lab follow EPA-approved protocols, holding times, and quality assurance/quality control procedures (Edwards and Wood 1993).
Soil Leachate & Soil Measurements - Soil leachate is collected from zero-tension lysimeters at monthly intervals when a sufficient sample volume is present (~ 5 times per year; Edwards and Williard 2006). No samples were collected from June 1993 through December 1995 due to budget constraints. Lysimeters were installed at 15 locations in both Watersheds 3 and 4 in 1988 and were first sampled in January 1989, allowing them ~5 months to equilibrate. At each location a lysimeter is positioned at the base of the A horizon, B horizon, and, whenever possible, at the base of the C horizon.
The soils in Watersheds 3 and 4 were intensively sampled at 15 locations in each watershed on three separate occasions - 1988 (mineral soil only), 1994 (organic and mineral soil), and 2002 (organic and mineral soil). Samples from several depth intervals (0-10, 10-20, 20-30, & 30-45 cm) were analyzed for chemical properties by an external testing lab. Samples from 1988 were lost by the analytical lab but a small subset was archived and subsequently analyzed. In addition, two comparisons were made by students of Dr. DeWalle at Penn State between the soil chemistry in Watersheds 3 and 7 in 1995 and 2000.
In situ estimates of annual net nitrification and N mineralization rates have been made in Watersheds 3, 4, and 7 by Dr. Gilliam at Marshall University. These measurements are made at seven locations per watershed and have been done on five separate occasions (1993, 1994, 1995, 2002, 2005). In order to extend this record, Fernow LTREB interns began assisting with these measurements in 2007 to ensure they continue on an annual basis.
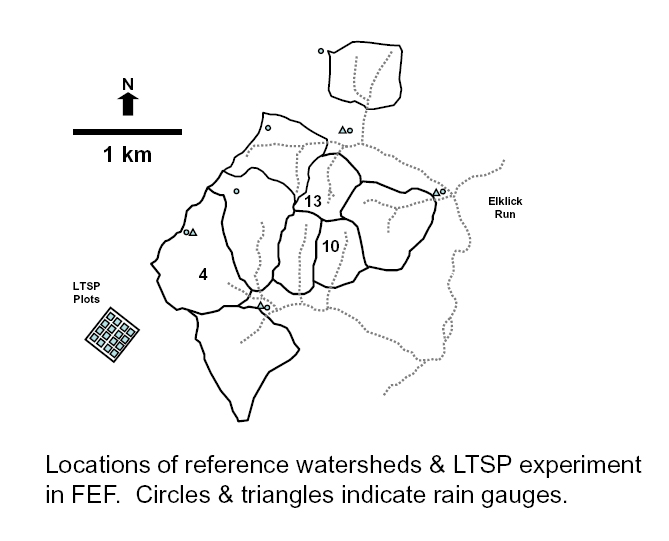
Vegetation Measurements – Vegetation is periodically measured on watersheds 3 and 7 using twenty-five randomly located plots (0.04-ha) per watershed. These plots were established in 1990 & 1991 and have been sampled four times since then (1996, 1999, 2003, & 2009). All trees >2.54 cm dbh within these plots are permanently tagged. On each measurement date the dbh, height, origin (seed or stump sprout), condition (live or dead), and species of each tree is recorded. Litterfall traps (1m2) are located near each sampling plot. These traps were established in 1988 (Watersheds 3 & 4) and 1991 (Watershed 7), and they are sampled annually during the fall season to determine the total dry mass of leaf litterfall. A single, plot-based census of the vegetation on watersheds 4, 10 (Christ et al. 2002) and 13 (Peterjohn unpub.) has also been conducted to address specific questions about the relationship between N availability and tree species composition.
Vegetation in the LTSP plots was measured prior to treatment (100% tally in 1996), immediately after treatments began (summer 1997), four years after treatments started (2001), and at five-year intervals thereafter. The vegetation in each LTSP plot is measured using twenty circular (1.13-m radius) plots for vegetation < 2.54 cm in diameter (Adams et al. 2004). On these plots all woody regeneration is counted and tallied by species, height class, and origin (seedling vs. sprout). All herbs and shrubs are also tallied for one quadrant (1/4 the area) in each plot. An additional twenty plots (4 m2 in size) were also established in the buffer area around each LTSP plot. In all of these plots regenerating trees, herbs and shrubs are tallied. In five of the buffer-area plots, 1/4 of each plot was clipped at ground level and all plant material (< 2.54 cm diameter, and <1 m height) collected, dried, and weighed. Beginning in 2006, all trees >2.54 cm dbh are permanently tagged in order to monitor growth, mortality and stand composition over time. In addition, one litterfall trap (0.9 x 0.9 m) is located in each LTSP plot to allow annual measurements of leaf litterfall.